
Dashboard Analytics
NOTE:As of October 2022, Dashboard Analytics is no longer maintained, and thus no longer available for purchase. Google’s discontinuation of the Out-Of-Band authorization flow for account authorization, and the overhaul of the Google Analytics API to accommodate GA4 both entail too much work to keep Dashboard Analytics alive.
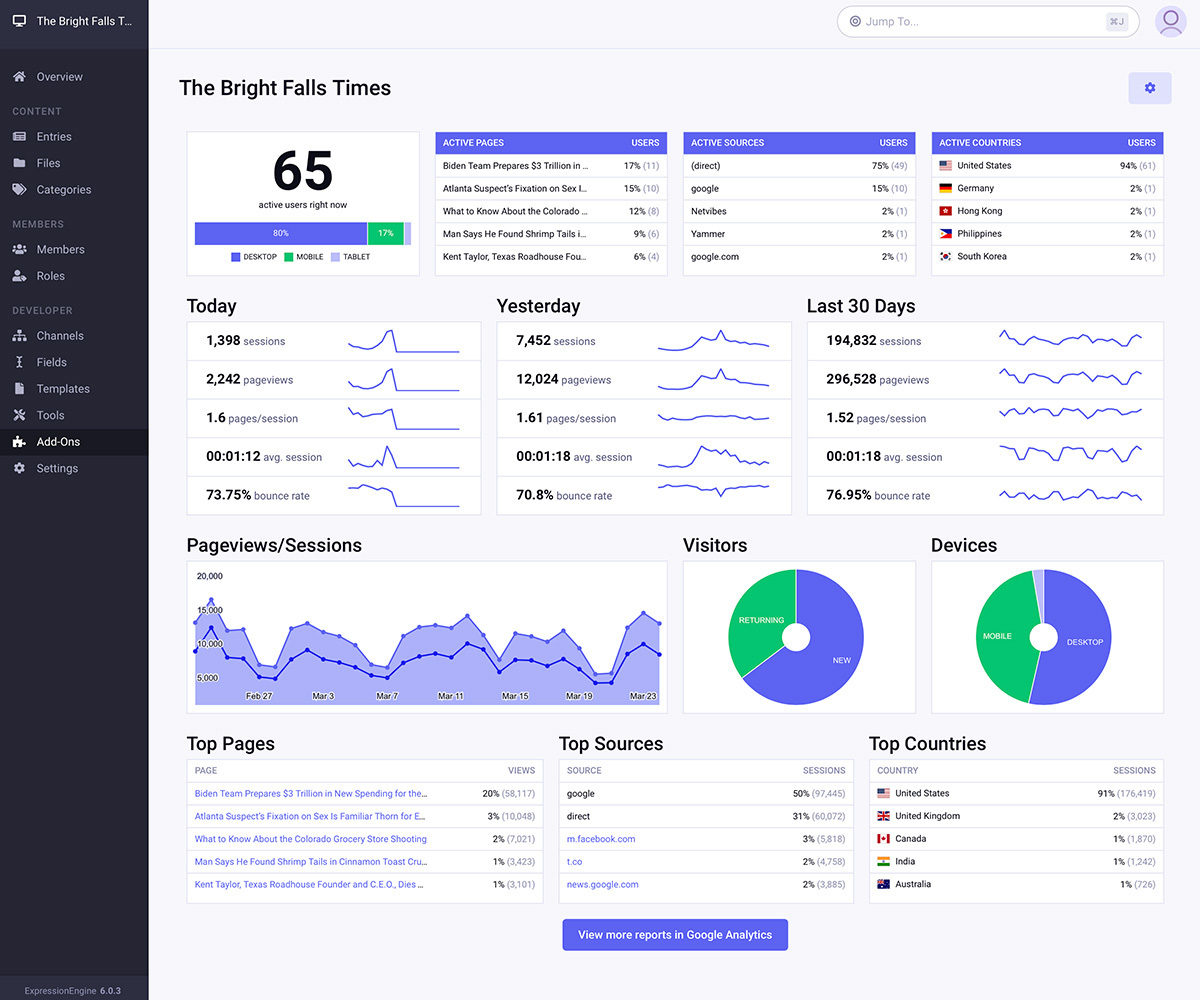
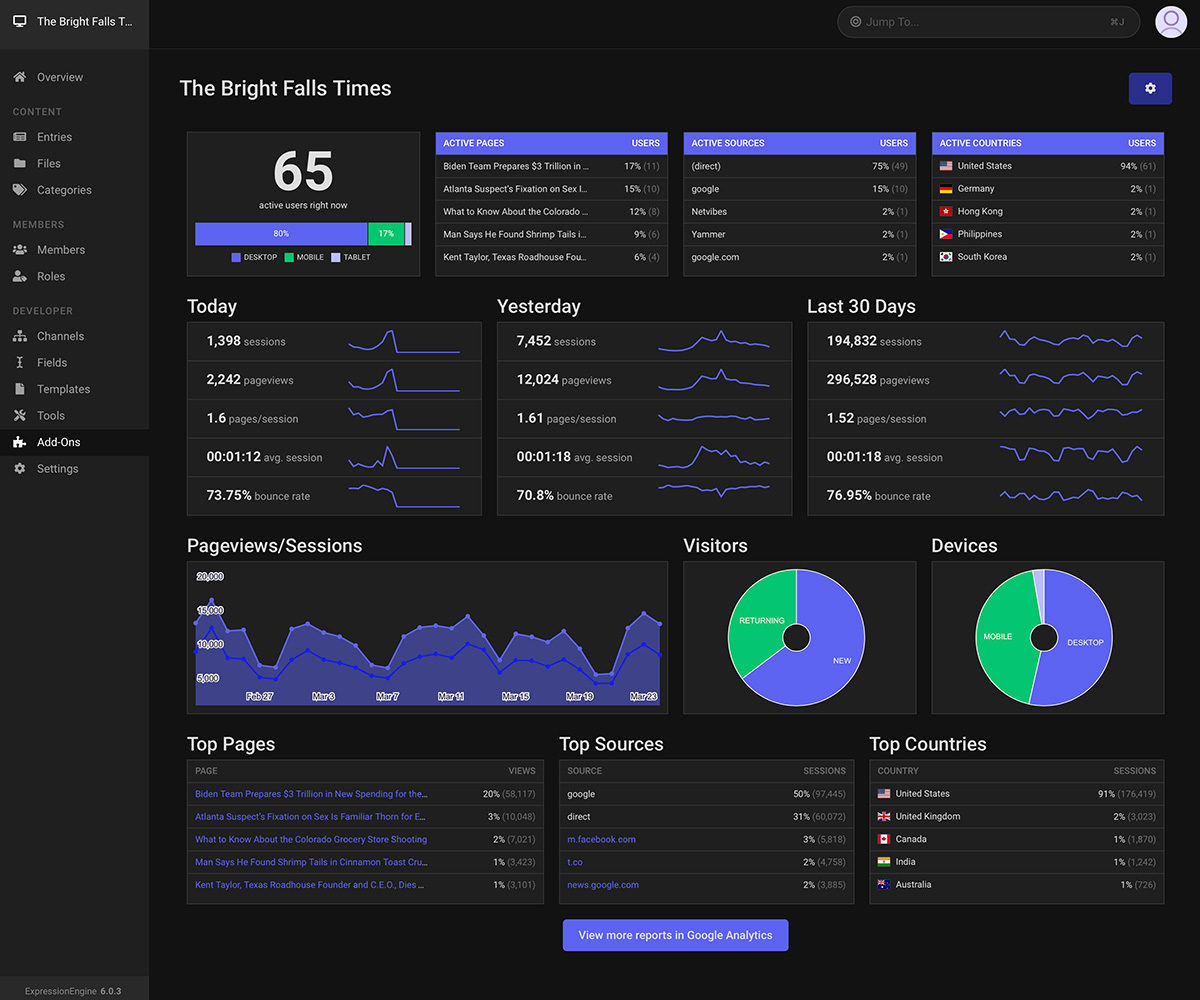
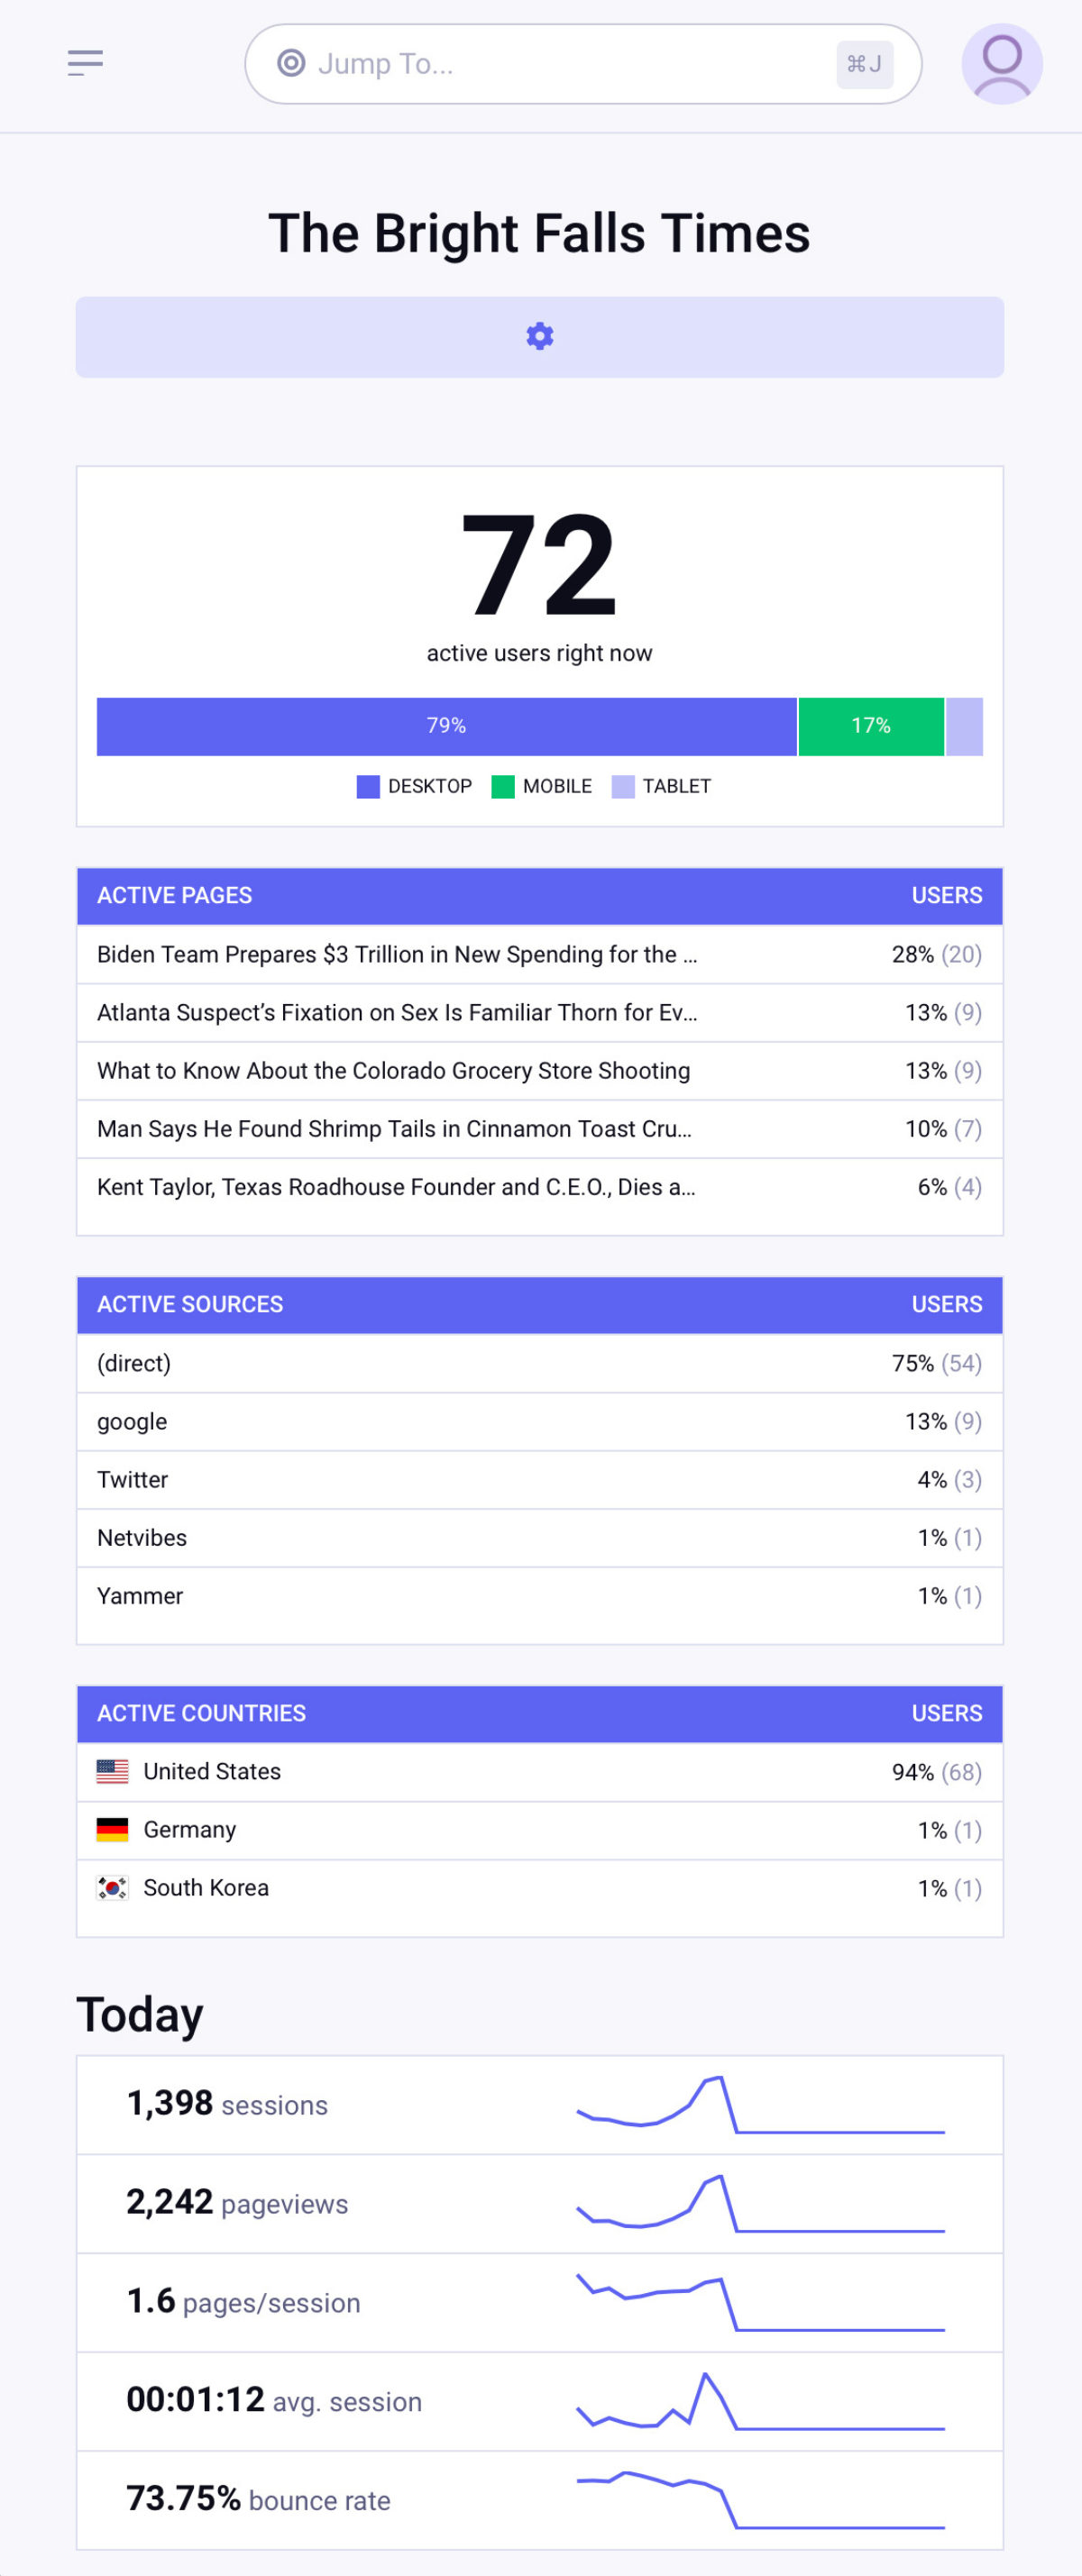
Dashboard Analytics replaces the default ExpressionEngine® dashboard with a beautiful display of your website’s Google Analytics traffic. Once authorized to connect to your Google Analytics account, the dashboard displays real-time traffic (which live-updates every 60 seconds) followed by a comprehensive overview of traffic from today, yesterday, and the past 30 days.
The real-time traffic display includes: the number of active users; a breakdown of device usage for the current active users (desktop, tablet, and mobile); the top five pages currently being viewed; the top five current traffic sources; and the top five current countries.
The overviews for today’s traffic, yesterday’s traffic, and last month’s traffic all include: total sessions, total pageviews; the average number of pages viewed per session; the average visit length; and the average bounce rate.
The last 30 days’ overview also includes: a line chart which follows daily sessions and pageviews for the period; a pie chart showing new versus returning visitors; a pie chart showing the breakdown of devices (desktop, tablet, and mobile); the top five pages for the period; the top five traffic sources for the period; and the top five countries for the period.
Screenshots
Requirements
- ExpressionEngine® 3.0.0 or greater
- PHP cURL extension
Documentation
Compatibility
Dashboard Analytics connects using version 3 of the Google Analytics Data API, which is not compatible with Google Analytics 4 properties. A GA4-compatible API has yet to be released, so there are currently no plans to support GA4 in the near-future.
Installation
Upload the included /system/user/addons/dashboard_analytics folder to your /system/user/addons/ directory, and the /themes/user/dashboard_analytics folder to your /themes/user directory, then install Dashboard Analytics from the Add-On Manager screen.
Configuration
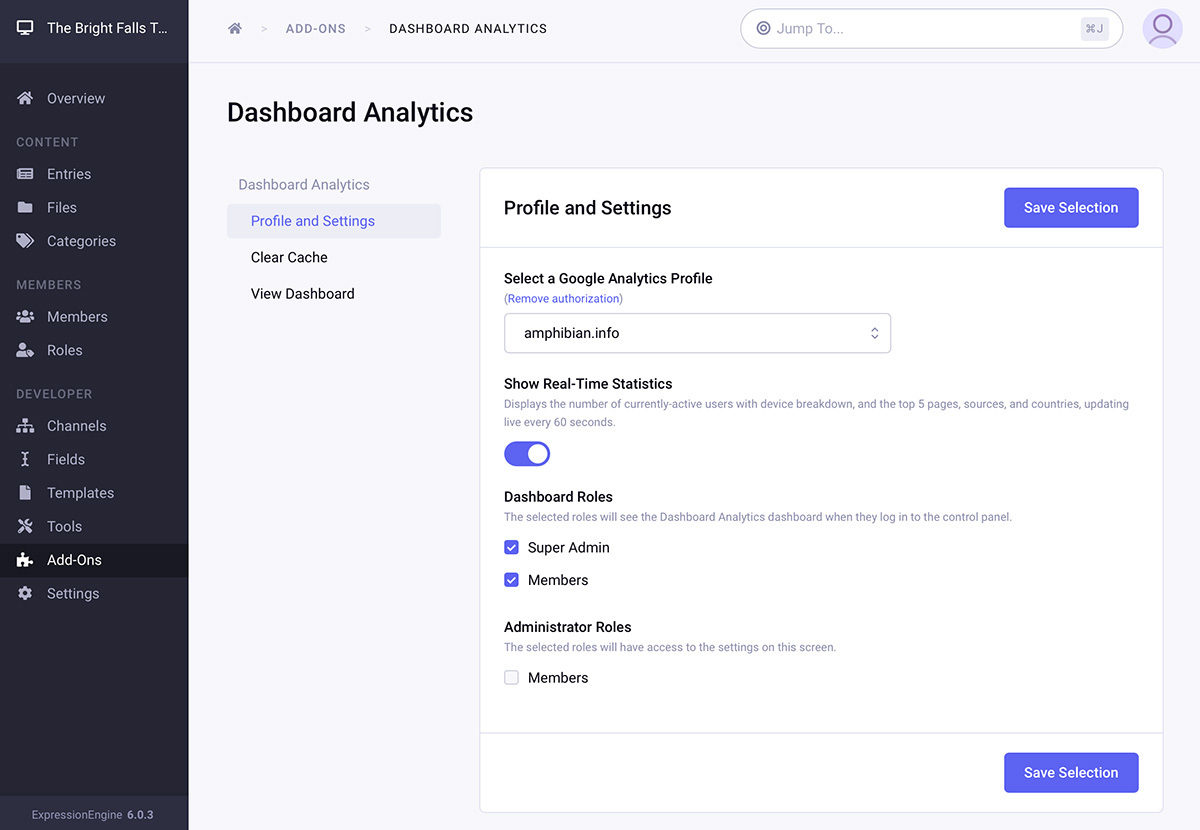
Visit the Dashboard Analytics settings screen by clicking its link on the Add-On Manager screen. Here you will need to follow the instructions to authorize Dashboard Analytics to connect to your Google Analytics account.
(Note that a single Google account can only generate 25 concurrent access tokens for Dashboard Analytics before the oldest of those token will be revoked – this may be relevant if you’re a developer or agency which manages their clients’ Google Analyics accounts under a single umbrella account.)
Once authorized, you’ll be presented with a list of Google Anlytics account profiles to choose from. Select a profile and save your settings.
One this screen there are a few additional settings:
- You may choose to disable the real-time traffic display — useful for low-traffic sites where that data is rather depressing.
- You can also select which member groups will be redirected to the Dashboard Analytics display after logging-in – though note that this setting can be made moot if a member group or member has their “Default CP homepage” setting changed manually, or has their access to the Dashboard Analytics add-on revoked. (Their CP homepage and add-on access can always be quickly restored by visiting this screen and re-saving these settings.)
- Lastly, you can select which member groups will be granted access to the Dashboard Analytics settings screen (to change profiles or other settings).
If you have multiple sites via MSM, each site will store its own distinct settings for Dashboard Analytics.
Caching
Data for the previous 30-day period is fetched and cached once per day, while the data for the “today” overview is fetched and cached hourly. Real-time data is never cached, and is refreshed dynamically every 60 seconds while the dashboard is being displayed.
You can clear all caches for the current site at any time by clicking the “Clear Cache” link in the module’s settings area.
Changelog
- 1.2.0 (March 25th, 2021)
- ExpressionEngine 6 support
- Removed channel menu and comment moderation links under EE6
- 1.1.0 (December 13th, 2018)
- Fix for correct site overview text not displaying under EE5
- 1.0.9 (December 10th, 2018)
- Fix for disappearing charts under EE5
- 1.0.8 (November 20th, 2018)
- Interface tweaks for EE5 compatibility
- 1.0.7 (June 20th, 2018)
- Fix for authorization token flow not opening in a new window in EE4
- Fix for some browsers caching real-time data requests, making the data not actually real-time
- 1.0.6 (November 3rd, 2017)
- Interface tweaks for EE4 compatibility
- 1.0.5 (May 15th, 2017)
- Fix for dashboard not loading when admin domain and site domain do not match
- 1.0.4 (January 26th, 2017)
- Fix for dashboard not loading on secondary MSM sites
- Fix for custom CP homepage screen not saving for secondary MSM sites
- Fix for custom CP homepage settings not being cleared out when Dashboard Analytics is uninstalled
- 1.0.3 (August 23rd, 2016)
- Fix for rare occasions where charts might try to load before the visualization library is available
- 1.0.2 (August 12th, 2016)
- Fix for South Korean flag icon not appearing in countries list
- Fix for intended dashboard screen heading not appearing in ExpressionEngine 3.4.1
- 1.0.1 (April 5th, 2016)
- Made profile titles more descriptive in the profile dropdown menu to account for multiple views per domain
- 1.0.0 (April 5th, 2016)
- Initial release